Analytics & Insights
Most companies only hear from customers when something goes wrong. Know Reply captures every reply to your campaigns, newsletters, and transactional emails and turns it into actionable insight.
Dashboards
Section titled “Dashboards”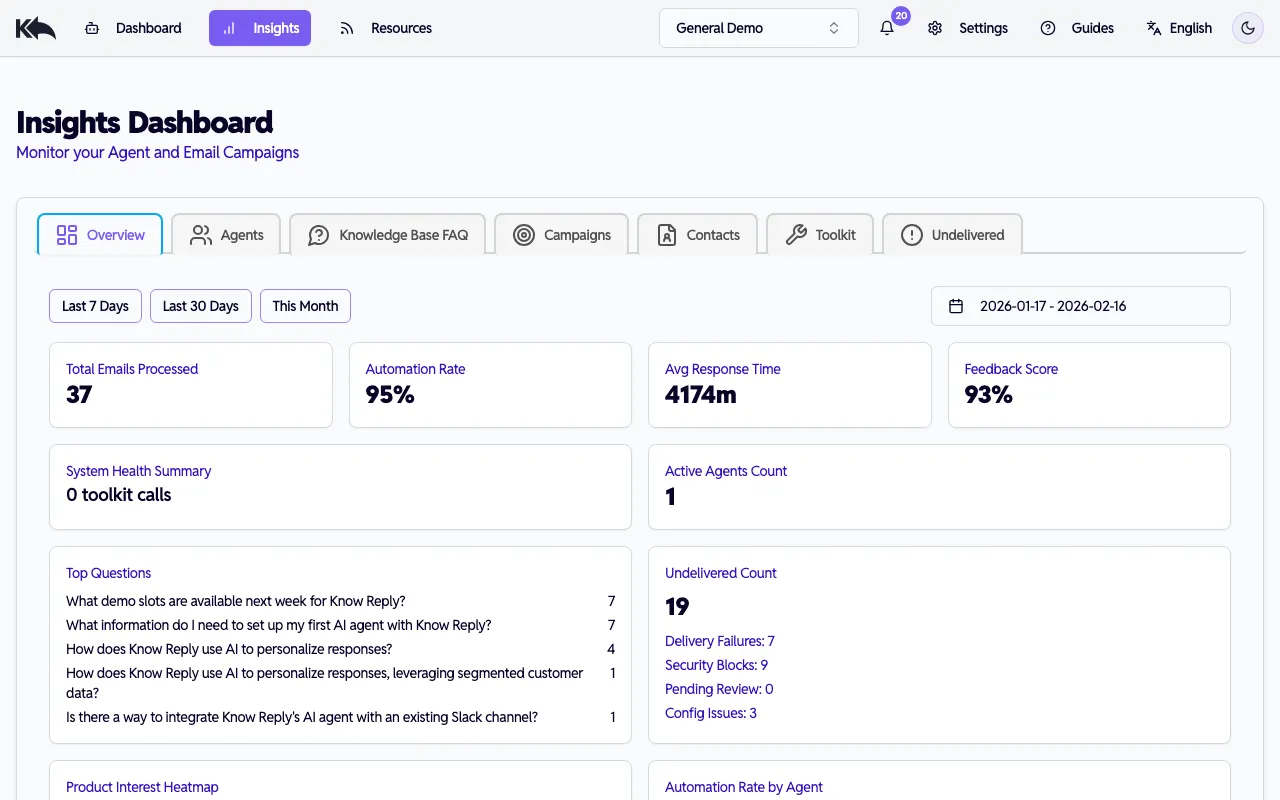
Know Reply includes several analytics views, each with date range filtering and agent/account filters.
Agents Dashboard
Section titled “Agents Dashboard”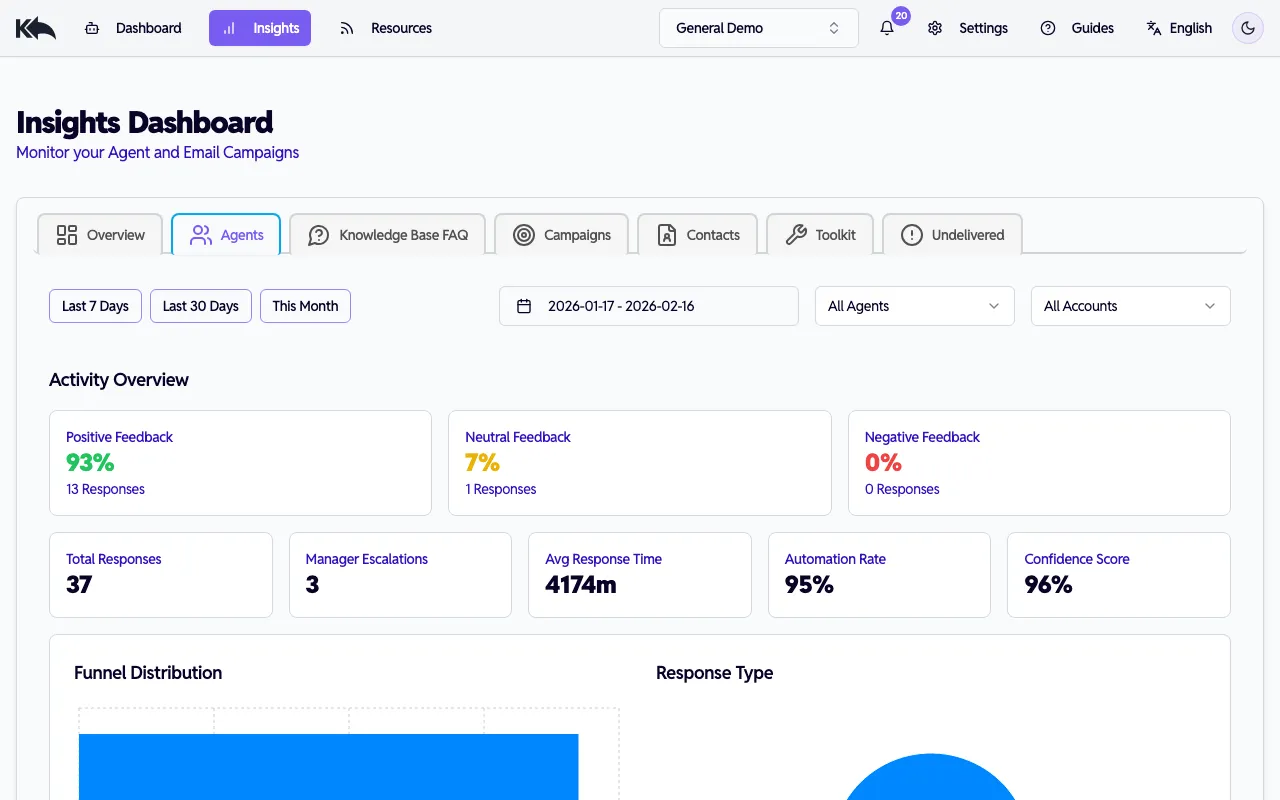
See how your agents are performing:
Activity Overview
- Positive, neutral, and negative feedback percentages
- Total response count
Response Quality
- Average confidence score
- Manager escalations
- Average response time (in minutes)
Workload
- Total responses
- Response type distribution
Filter by date range, agent, or email account to drill into specific performance.
Campaigns Dashboard
Section titled “Campaigns Dashboard”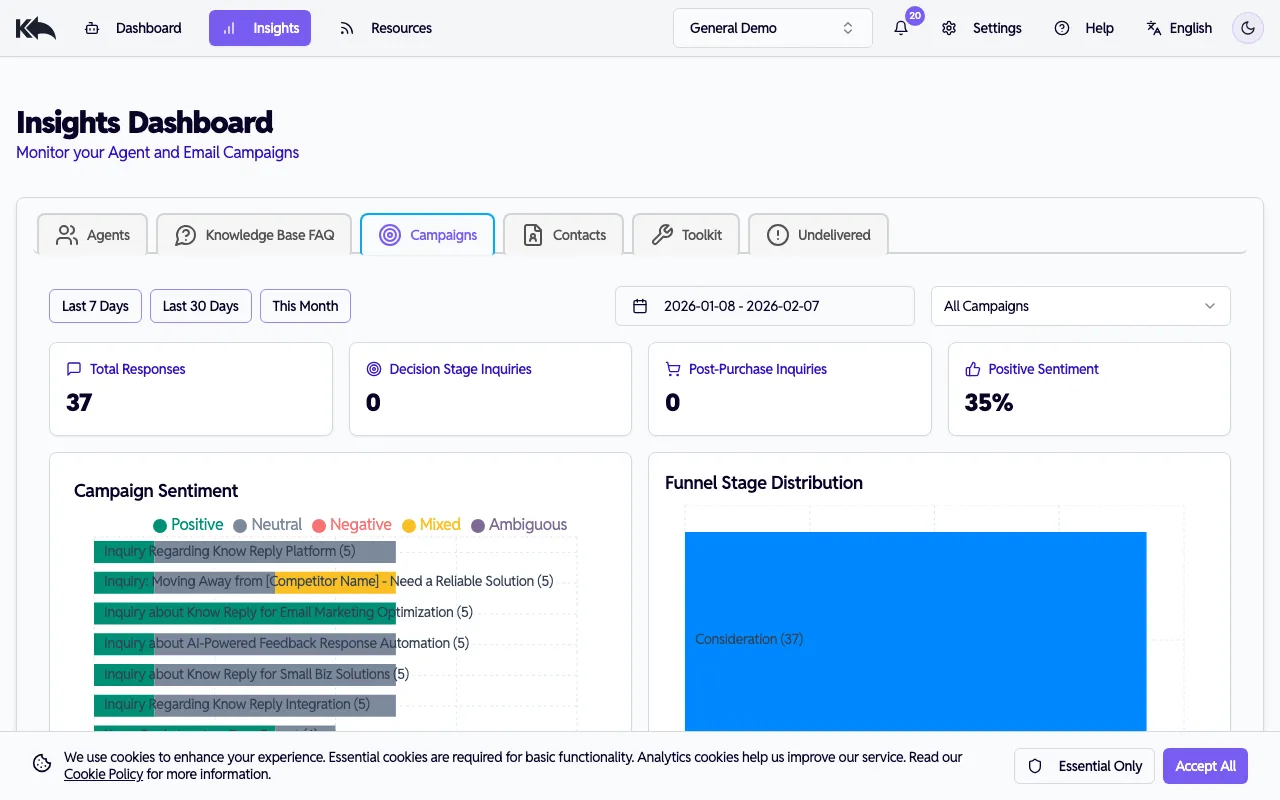
Understand how people react to your sends:
- Subject Ranking - Which email subjects drive the most replies
- Funnel Distribution - Where contacts are in their journey (Awareness, Consideration, Decision, Retention)
- Response Types - Categories of replies received
- Escalation Reasons - Why conversations needed human attention
- FAQ Occurrences - Common questions being asked
- Conversion Potential - Buying signals detected
- Retention Feedback - Sentiment from existing customers
Filter by email subject to see metrics for a specific campaign.
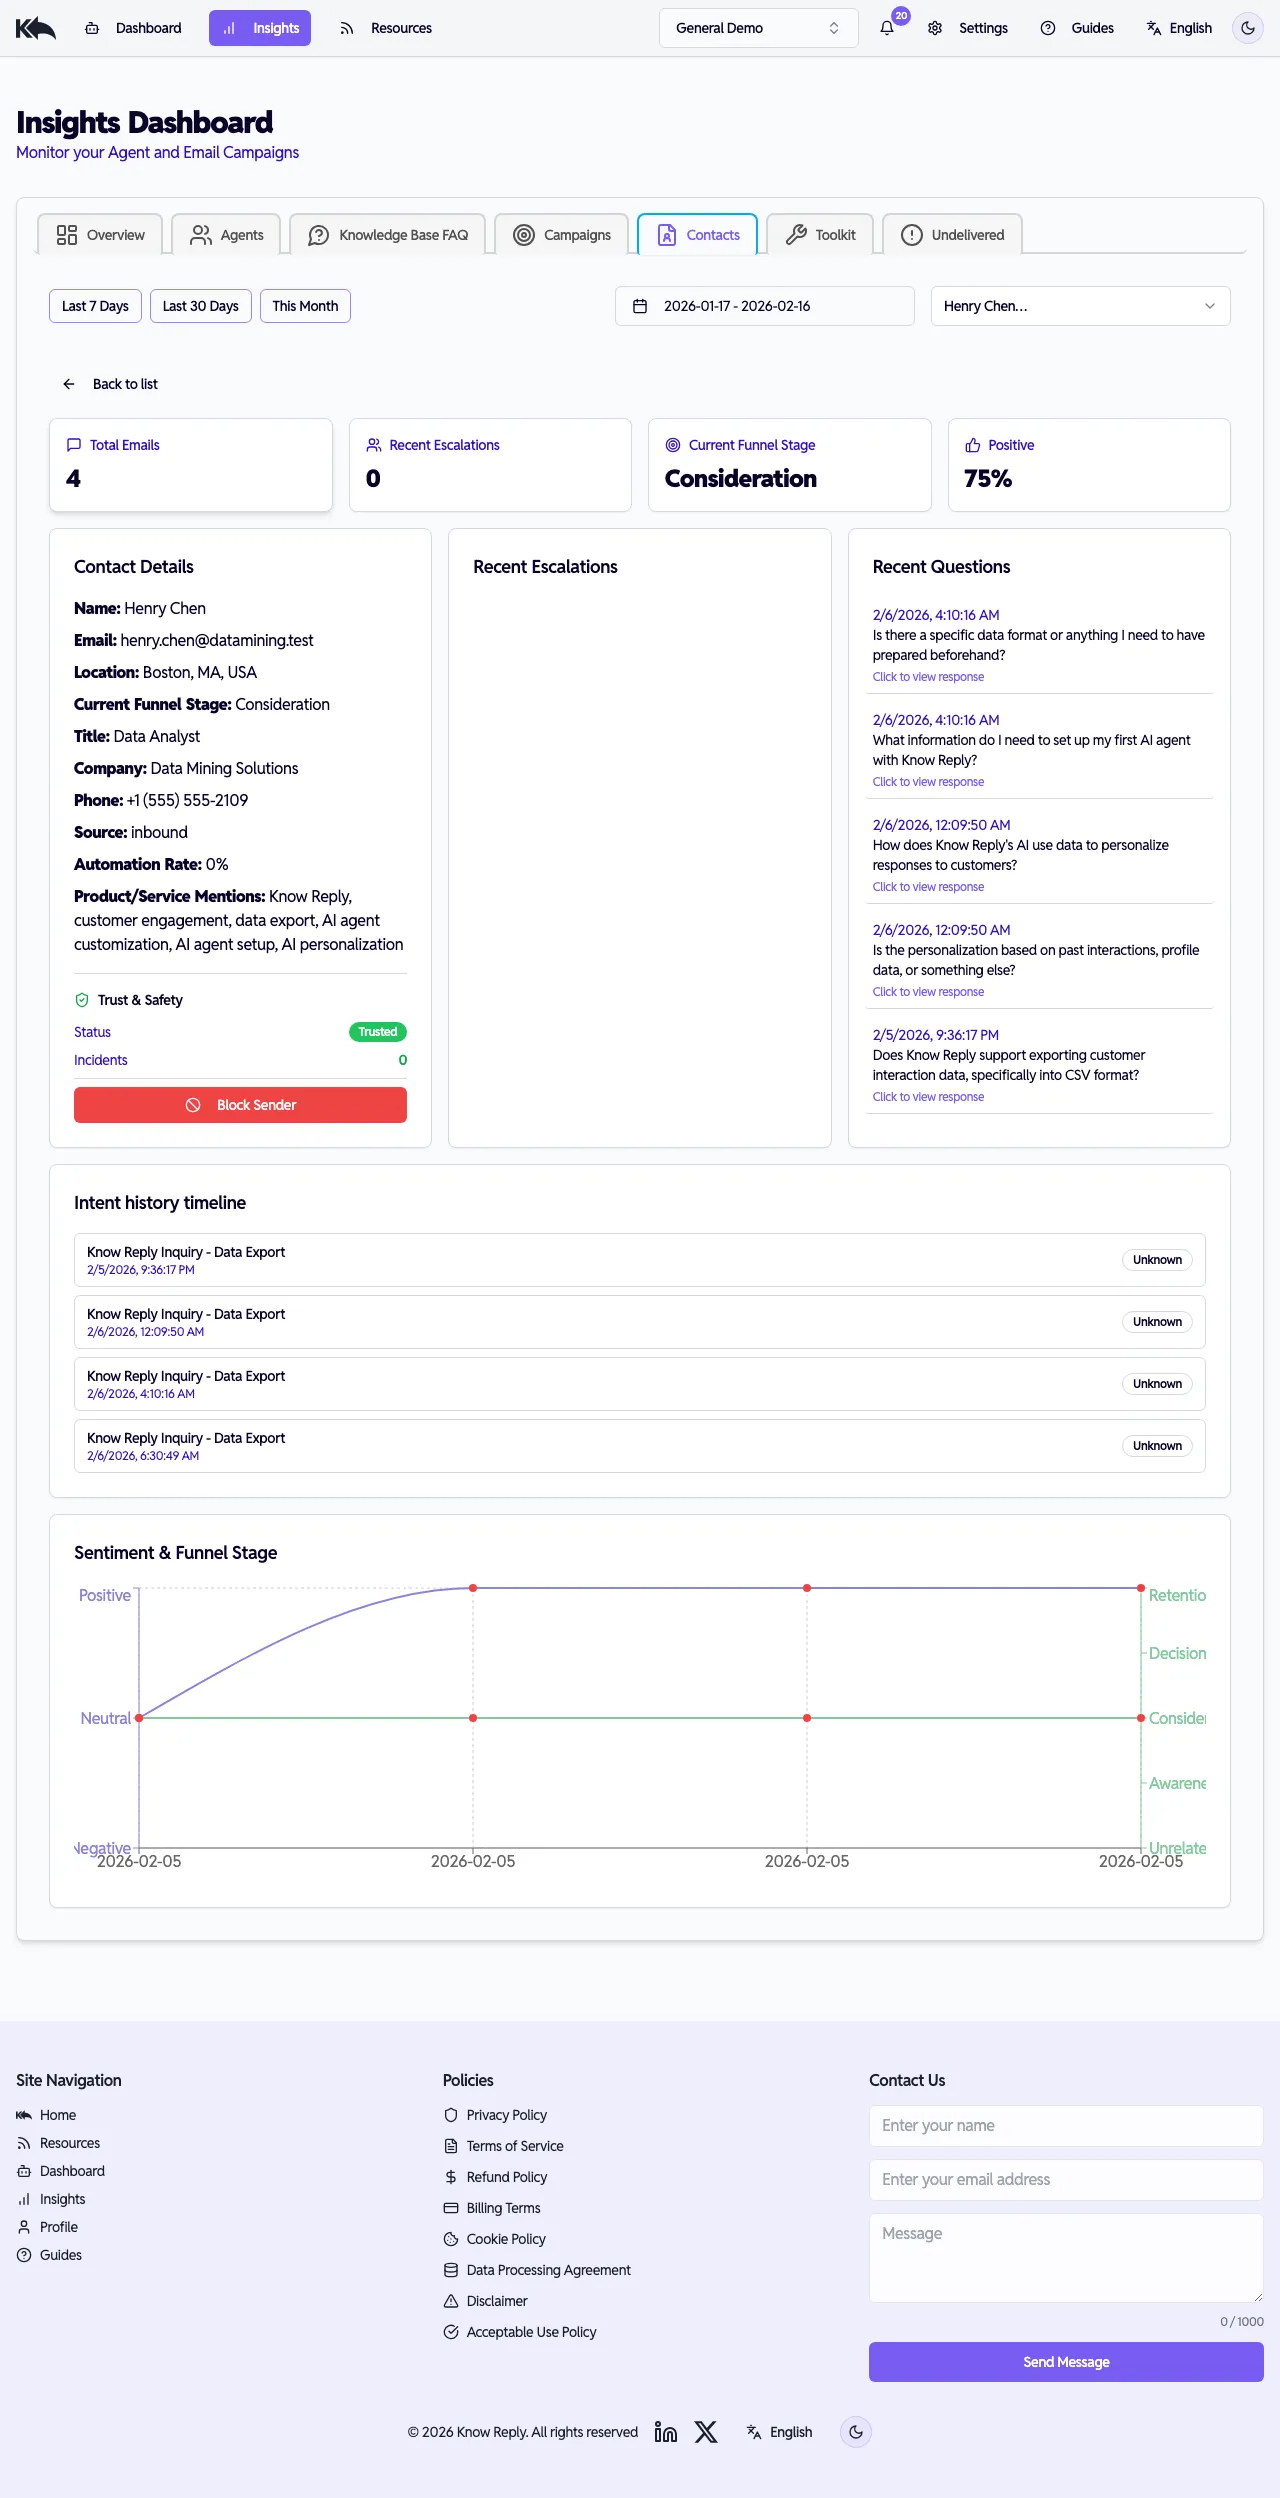
Customers Dashboard
Section titled “Customers Dashboard”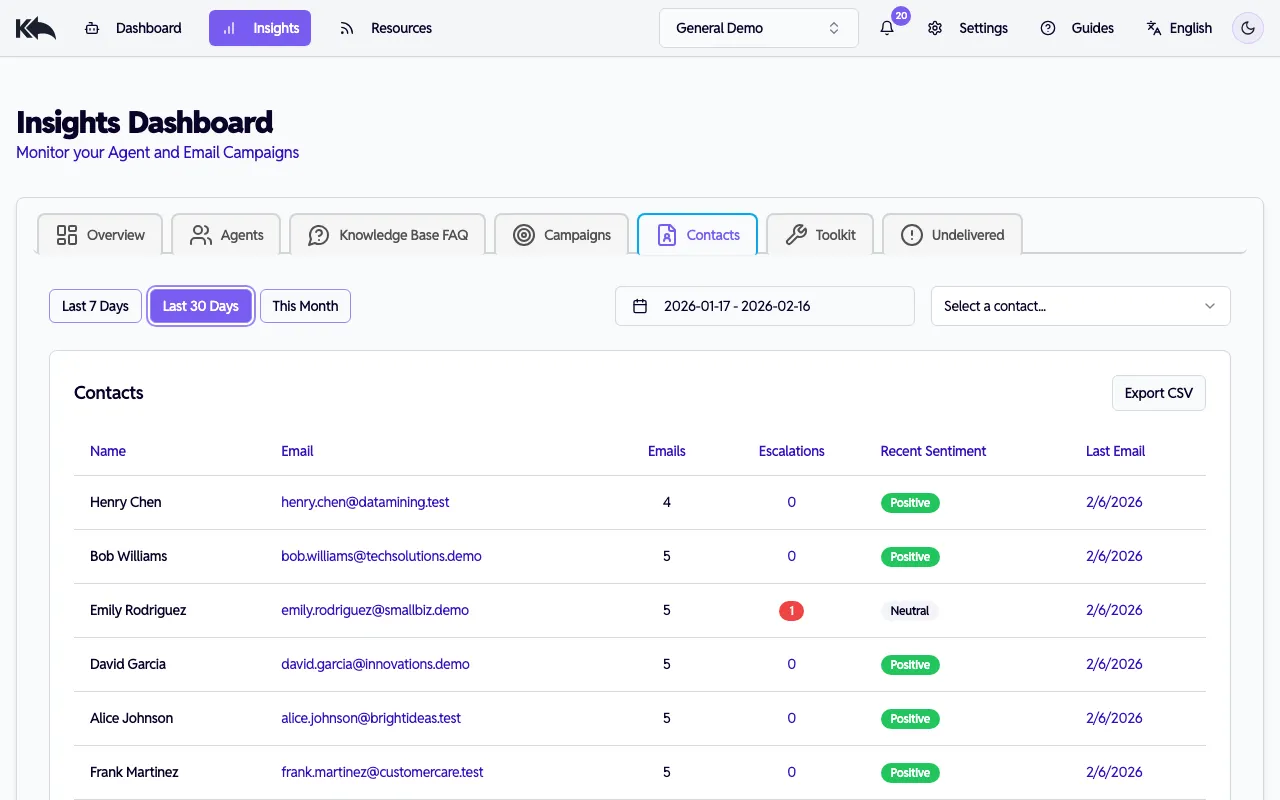
Track contact engagement and sender trust:
- Contact list — all contacts with email count, escalation count, recent sentiment, and last email date
- Contact detail — click any contact to see their full profile:
- Funnel stage and sentiment breakdown
- Recent questions and escalation history
- Trust & Safety section — trust status, incidents, recent events, and the ability to block/unblock senders or clear trust incidents (see Sender Trust & Safety)
- Click a sender’s email in the Undelivered dashboard to jump directly to their contact profile
Knowledge Base & FAQ Dashboard
Section titled “Knowledge Base & FAQ Dashboard”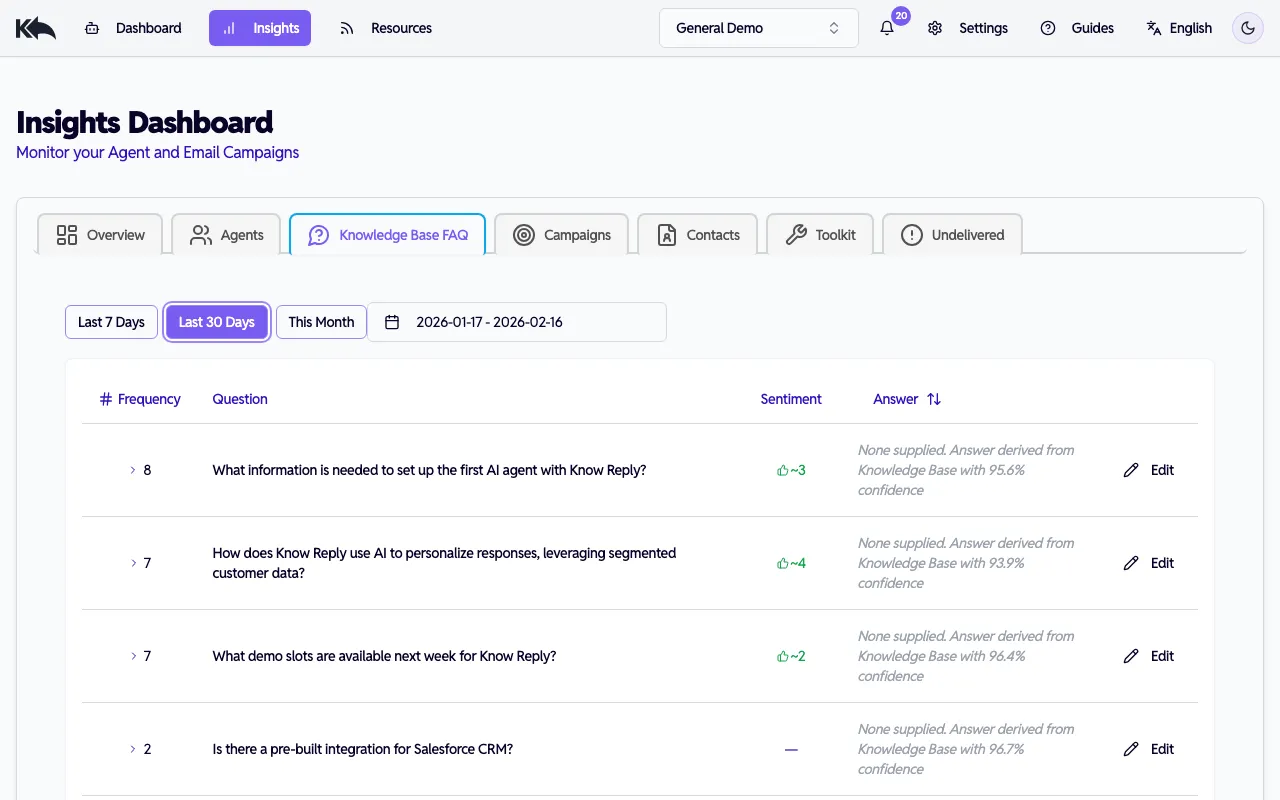
See which questions come up, how well your content answers them, and what customers think of the responses:
- Frequency — how often each question appears
- Sentiment — approximate positive and negative feedback counts from customers, with a breakdown of new feedback since your last review
- Answer — the current FAQ answer (or a note that it’s derived from the knowledge base with a confidence score)
- Underperforming FAQs — highlighted with an amber background when they receive 3 or more negative responses in the last 30 days
Reviewing FAQs
Section titled “Reviewing FAQs”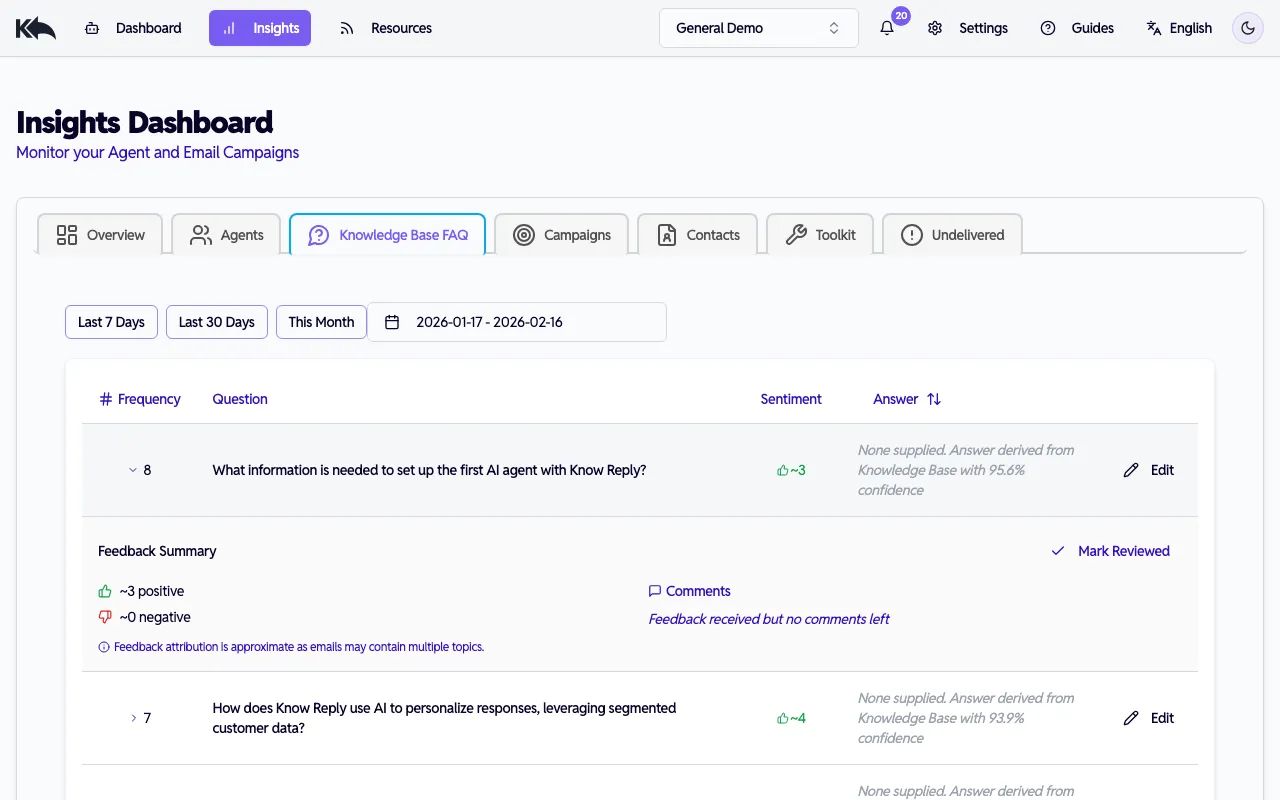
Click any FAQ row to expand and see:
- Feedback summary — positive and negative counts, with “since last review” breakdown
- Comments — customer comments split into “New” (since your last review) and “Reviewed” sections, color-coded by sentiment
- Edit — update the FAQ answer inline. Saving automatically marks the FAQ as reviewed and re-embeds the content.
- Mark Reviewed — acknowledge current feedback without changing the answer. The FAQ will reappear if new negative feedback accumulates.
Sort by frequency, confidence, or answer status. Edit answers inline to improve coverage.
Toolkit Dashboard
Section titled “Toolkit Dashboard”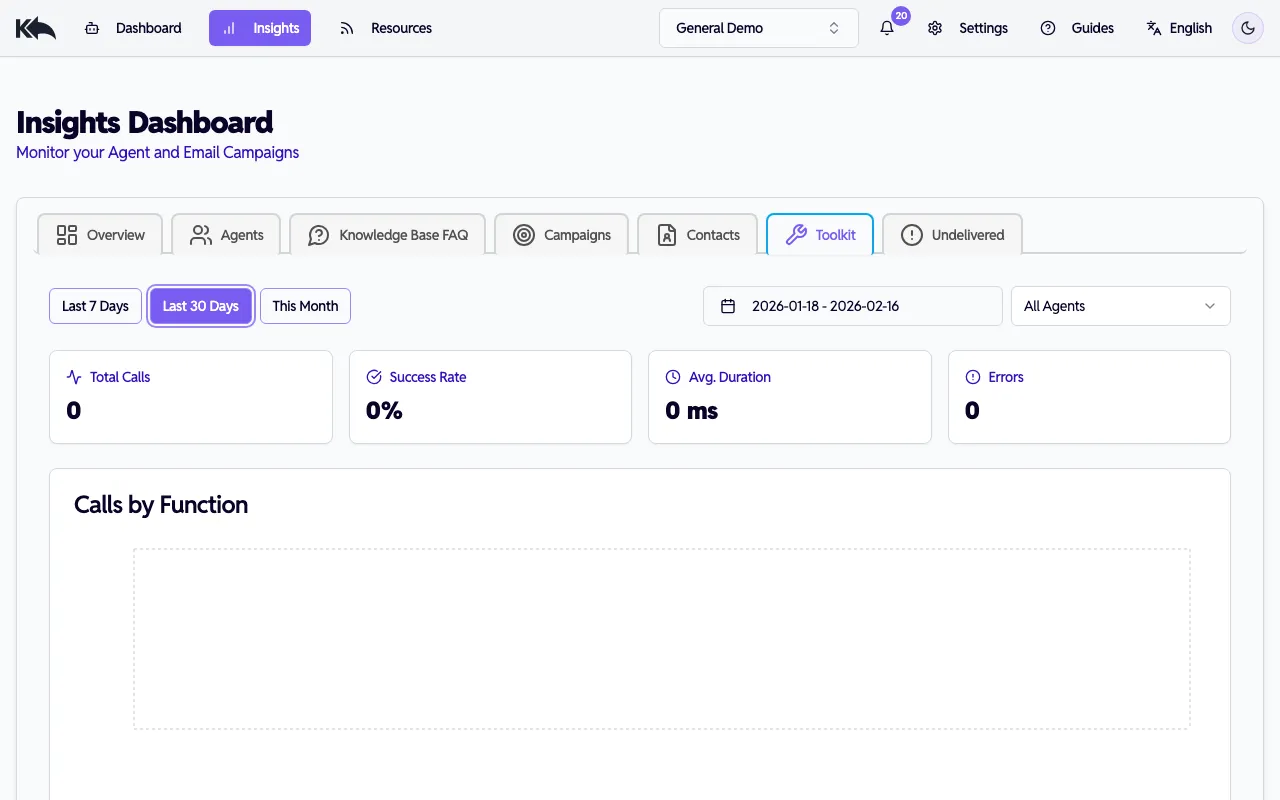
Monitor your integrations with detailed per-server and per-function breakdowns:
Summary cards:
- Total calls, success rate, average duration, error count
Per-server health table:
- Each connected server shows calls, success rate, average duration, p50/p95 latency, and error count
- Click any server row to expand and see per-function stats — the same metrics broken down by individual function
- Click an error count to see the full error messages with timestamps
Charts:
- Calls by function (bar chart)
- Error pattern timeline (line chart, paid plans)
Recent events log:
- Last 20 tool calls with timestamp, server, function, status, and duration
- Hover over error badges to preview the error message, or click to see the full detail
Filter by agent or date range.
Undelivered Dashboard
Section titled “Undelivered Dashboard”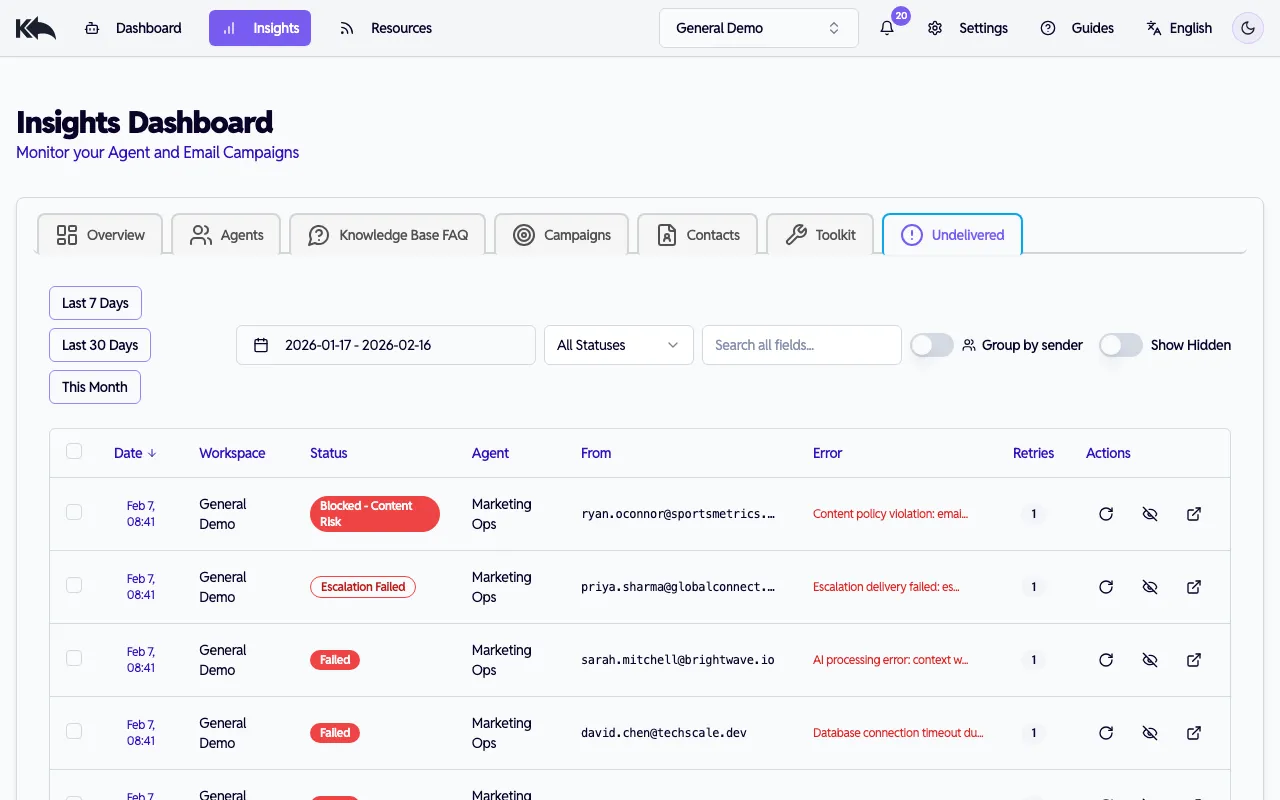
Track emails that weren’t processed by your agent:
- Status categories — pending, processed, failed, send failed, unmapped, inactive agent, limit exceeded, rejected (spam/bounce/auth), trust quarantined, trust blocked, rate limited, content blocked, escalation failed, and more
- Group by sender toggle — groups emails by sender address showing worst status, incident count, and last seen date. Expand each group to see individual emails.
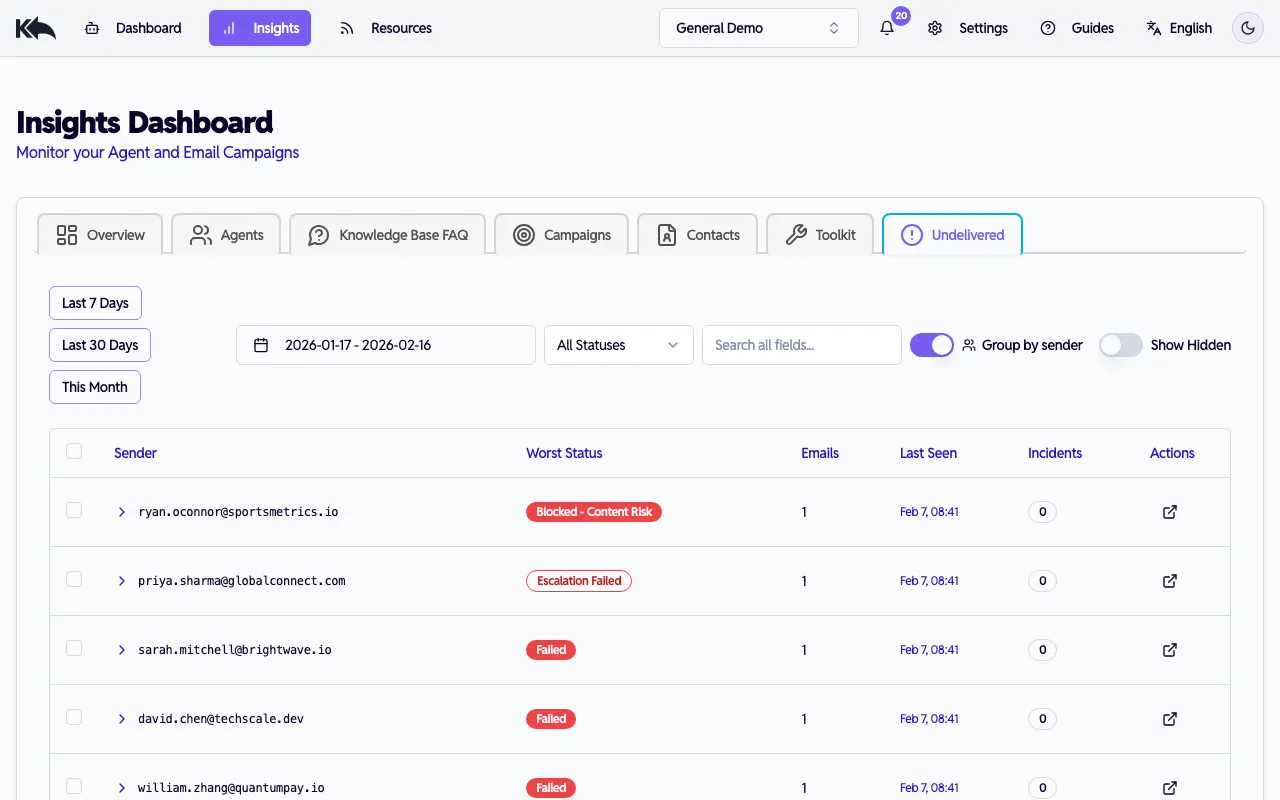
- Actions — retry emails, hide/unhide from default view, or click a sender to view their contact profile and trust details
- Sortable columns — sort by date, status, sender, retry count, or agent
Using insights
Section titled “Using insights”Content strategy
Section titled “Content strategy”See questions your audience asks that your knowledge base doesn’t answer well. These are your content gaps—topics to add or improve.
Campaign feedback
Section titled “Campaign feedback”Compare sentiment and topic distribution across different email subjects to see what resonates.
Customer deep dive
Section titled “Customer deep dive”Click any contact to see their full interaction history: every question, every reply, sentiment changes, escalations.
Date ranges
Section titled “Date ranges”All analytics dashboards (Agents, Knowledge Base & FAQ, Campaigns, Customers, Toolkit) support date range filtering:
- Free tier: Defaults to last 7 days, capped at 7 days of data
- Paid tiers (Starter and above): Default to last 30 days, capped at 2 years of data
The Undelivered dashboard has its own date range behavior:
- All tiers: Defaults to last 30 days, capped at 2 years of data